Experience Goal
Data Is Not Rocket Science. It's Open Science.
Mighty Fine Print
And now for the disclaimer. All confidential information has been removed in cooperation with the non-disclosure agreement (NDA) and governmental clearance regulations. Any stats may have been altered to not disclose any data. This case study is a reflection of my own views and not necessarily the views of NASA.
Science Tools Are Hard To Use
Problem
How to make science easy and accessible?
To ensure that we met the goal to make data and research open and FAIR (Findability, Accessibility, Interoperability, and Reusability), we had to be honest with ourselves as engineers and realize that our products could be too complex and confusing for even scientists to use.
Questions
Once that realization had set in, the questions started flowing. My team and I wondered:
- Who are our users?
- Do we have primary users? If so, what makes them different from our other users?
- How do they currently find, use, and share data? And what is the ideal for them?
- What type of data do they need?
- How do we guide users through the process?
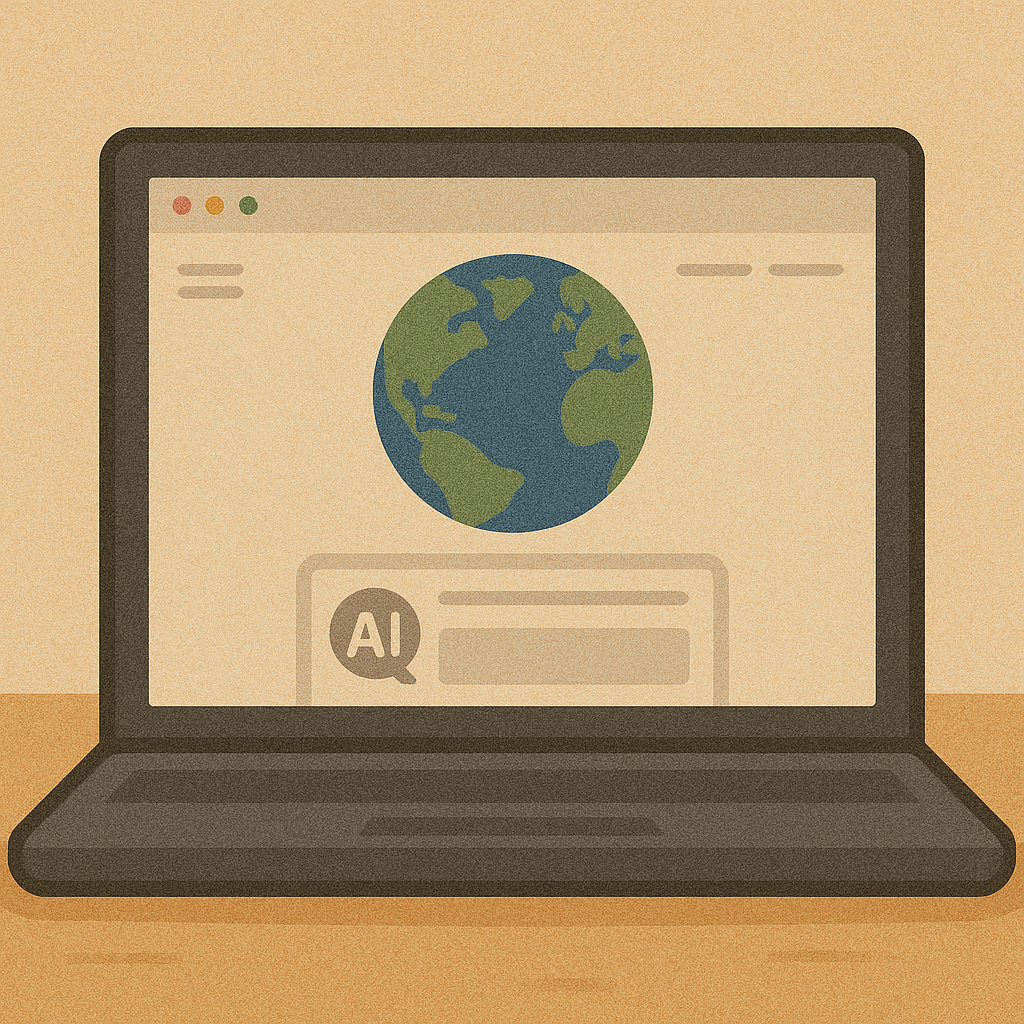
- How can we incorporate AI to help the user?
About 3 out of 5 users stated that finding science data is difficult.
Product Background
The NASA Earthdata Science program comprises of open-source and enterprise SaaS products. These applications allow scientists, developers, and the general public to find, use, and monitor data. This includes data visualization, cloud services, documentation, and dataset retrieval.
Industry
Aerospace, Science & Technology, Enterprise
Focus
Applied Climate Science, Data & Visualization, Cloud, Development Tools
OS Environments
Web, iOS and Android mobile, VR/AR
Role
Activities
During my tenure on the NASA Earthdata Science program, my activities included research, testing, visual design, prototyping, front-end UI development, documentation, and Agile leadership practices. As a leader, I mentored interns and supported other design/UI engineers on cross-functional teams.
I worked on various efforts in our product ecosystem. They are as follows, but not limited to:
- Stages of data:
- Data discovery
- Data validation
- Data ordering and checkout
- Ingest, archive, curation, and data management
- User workflow handoff and APIs
- Product optimization
- Earthdata User Interface (EUI) Design System
- AI/ML integration and automation
In this case study, you will mostly see examples of projects under my leadership.
Toolbox


GenAI
Discovery
We started the design process by validating user needs and business requirements through user research and metrics.
Since most users stated that the first step in the data process, “finding data”, is difficult, we had some serious work to do. We wanted to know what “difficult” really meant, how we could alleviate the blockers, and what a typical user workflow is, before we could even think about building the ideal enterprise solution.
Interviews, Surveys and Workshops
If the hours of research were a movie, that above would be the title. We had various years of fragmented research (I even participated in some of them in the past), but most of it was before we transitioned our focus on the cloud to be more in line with Open Science.
Team Effort
Hours of R&D
Virtual Research Stack
Coffee Refills
We reviewed the previous research and made observations along the way to help us avoid duplication or inefficiencies. In the process, I consolidated all previous research and hosted it in one location. Then we conducted our new feedback studies with users and product stakeholders.
If I can’t find the data within an hour, I just give up.
Earthdata Science Terrain
User Feedback: Find, Use, and Share Data
- Search: Confusing to know which NASA or science partner product to use.
- Download: Narrowing down results and ordering the data to download can be cumbersome and overwhelming.
- Script/API: Likes that data is accessible in a Jupyter notebook or in the cloud but AWS can be quite a learning curve.
- Analysis: Lack of code snippets and quick interactive visualizers.
- Documentation: Agencies use too much jargon. Some datasets have no linked documentation. Need clear, concise, and guided information with tutorials.
- Share: Wants options to collaborate easily with colleagues throughout the process.
User Personas & Journeys
We created updated personas and their respective journeys. For this effort, our focus was on the primary users, even though we did acknowledge that we have subtypes.
Meet Our Earthdata Personas

Scientist/Researcher

Data Analyst & Modeler

Educational (College/University)

Community/Agency Representative

Developer
- Scientist/Researcher: Uses data to support research, validate hypotheses, and publish findings.
- Data Analyst & Modeler: Analyzes data to build models, predict trends, and influence policy/public decisions.
- Educational (K-12/College/University): Incorporates data into curricula to promote data literacy and seeks credible data for academic projects, needing reliable sources for citations.
- Community/Agency Representative: Manages data governance and uses it to inform strategic decisions within an organization. Note: Prefers gathering data through visualizations and least likely to know how to analyze data.
- Developer: Creates user-friendly interfaces and solutions that streamline data processing and improve researchers' and analysts' access to data.
Let It Flow
Then we wanted to see how a user navigates within our ecosystem and map their steps to the functions, features, and services that we offer.
We started with the novice route and what that looks like, because we could build upon that to the advanced scientist/researcher workflow.
After working through personas, journeys, and workflows, we dived into scoring and comparing each data tool.
Their workflow isn't always linear and they may use different products for the same result.
Analysis
In our investigation, we examined the data types and storage, data usage, user personas and their needs, pain points, happy paths, blockers, and workarounds.
Looking At The Details
First, the team and I familiarized ourselves with the types of data that NASA collects and how users select them for their tasks.
Data Types
Satellite
Airborne
Sensor (land/water-based)
Data Usage
Users expressed that they like to explore coincidental data and other non-NASA data in our portfolio as well. This allows them to investigate various data types and compare them for the best result. Outside of Earth Science mission-driven data collection, there are citizen scientists who contribute data in various formats. This has become popular because of the accessibility of mobile and other devices.
There is a known issue that surfaced during our user sessions and that is trying to use these different types of data formats and what they need as a final product. We have worked on solution pathways that incorporate AI to help with the various formats and the analysis time, so that users can easily work with the data.
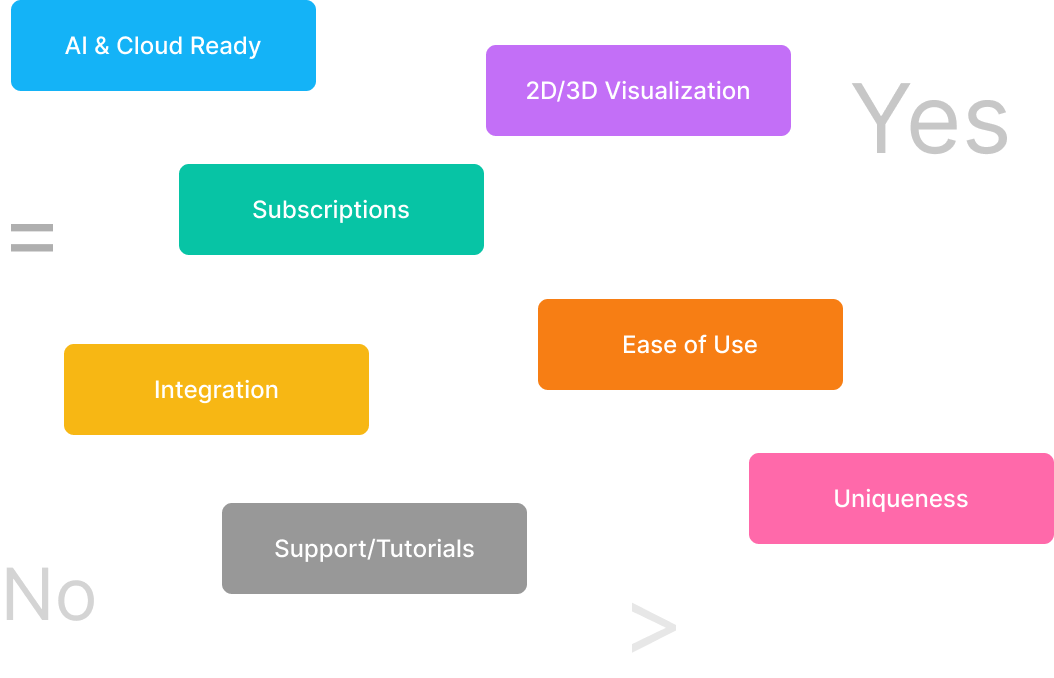
Score Says
Our research up to now has been focused on the user and their behavior and interactions. Now we aim our efforts at how the tools we have today serve the user's needs. We weighed the products based on functions and user interactions. Then scored the primary feature of the tool and listed if there is an alternative product/service. It was important to examine where the handoffs are and if we could achieve a centralized experience.
We shook the magic 8 ball and it told us:
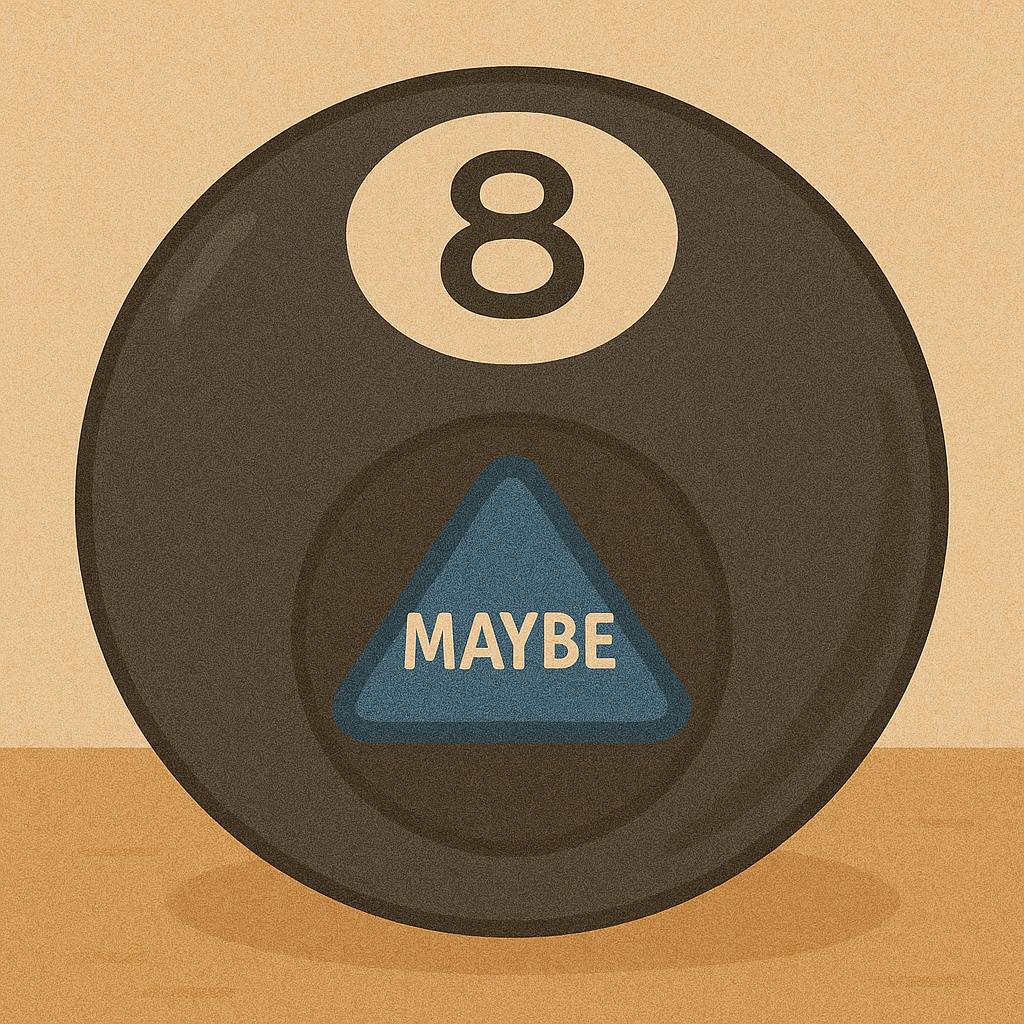
We have duplication in some of our tools, especially with faceted search, visualizers, and subsetters. Some of them had amazing features like the true 3D exploration options but lacked other functions. There are a few that technically aren't able to be transformed to the cloud. It's not easy to kill your darlings, so for now, we are looking at ways to incorporate certain unique features/functions into our flagstaff search and discovery products and plan accordingly to another path for the others.
What's Next
We are iterating and gathering feedback to provide to the feature development team and business stakeholders. This continuous engagement has helped us develop a stronger relationship with our primary users in the STEM community.
I'm glad that we are continuing to talk with NASA and get to see the new changes.
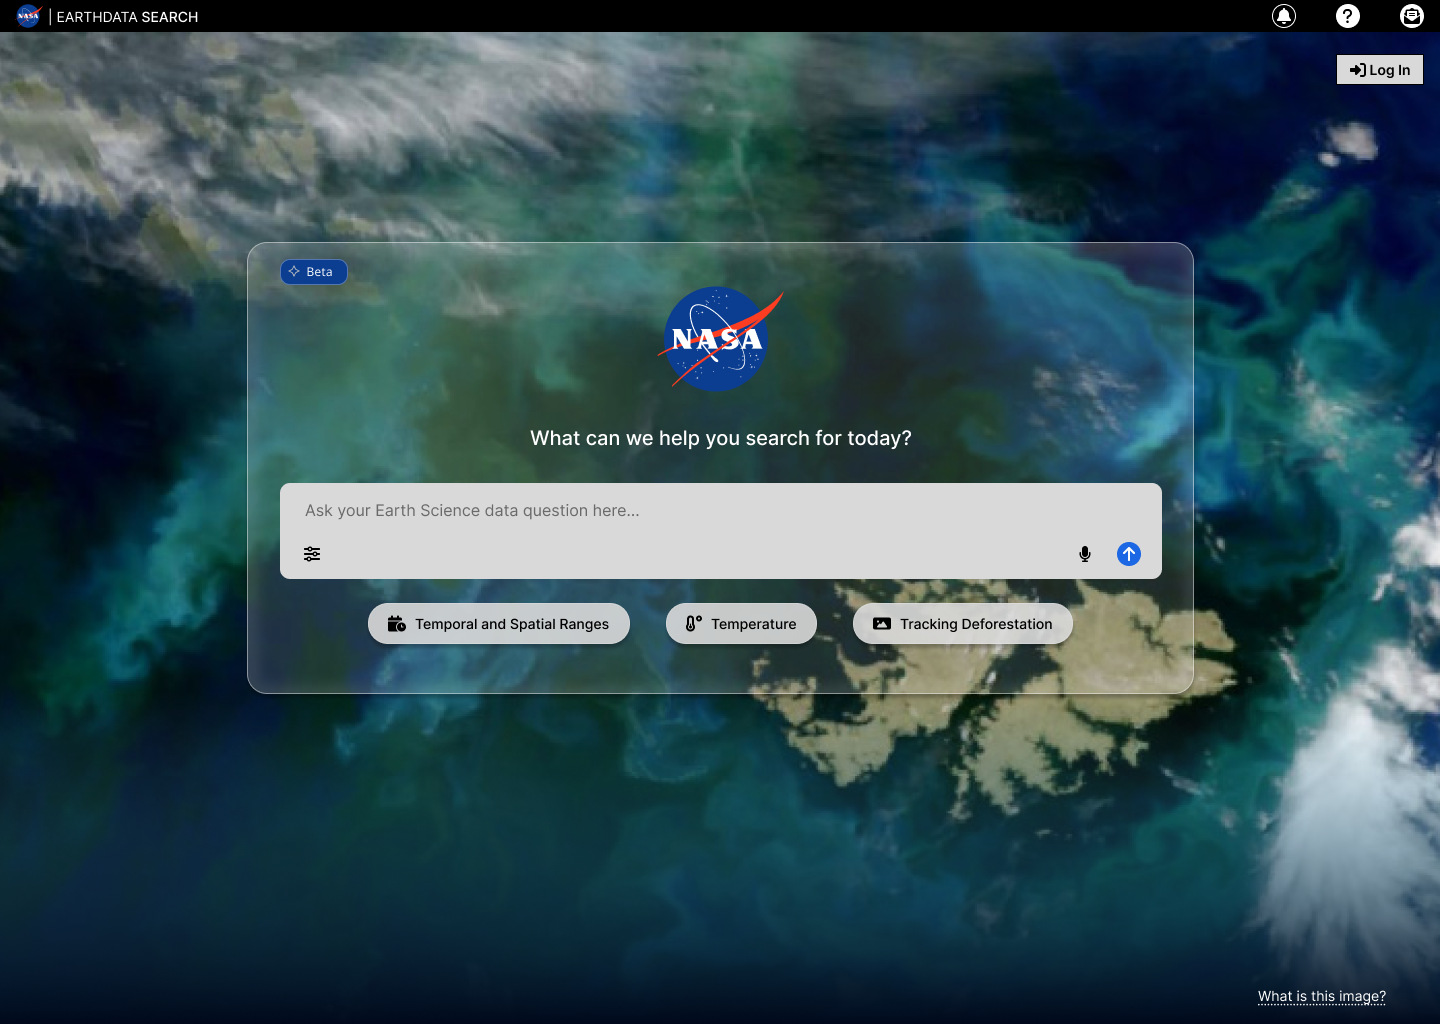
I have been championing more augmented experiences for the user. At NASA, we are not new to artificial intelligence and we have been implementing machine learning in our products for years now. However, I wanted to see how we could surface AI on the UI for the user to interact with. Is there any value in using AI in search and analysis with our products? We have been capturing feedback and tweaking along the way. As we continue to explore AI, I’m pretty excited about what’s on the horizon.
NASA Earthdata Search Landing Options
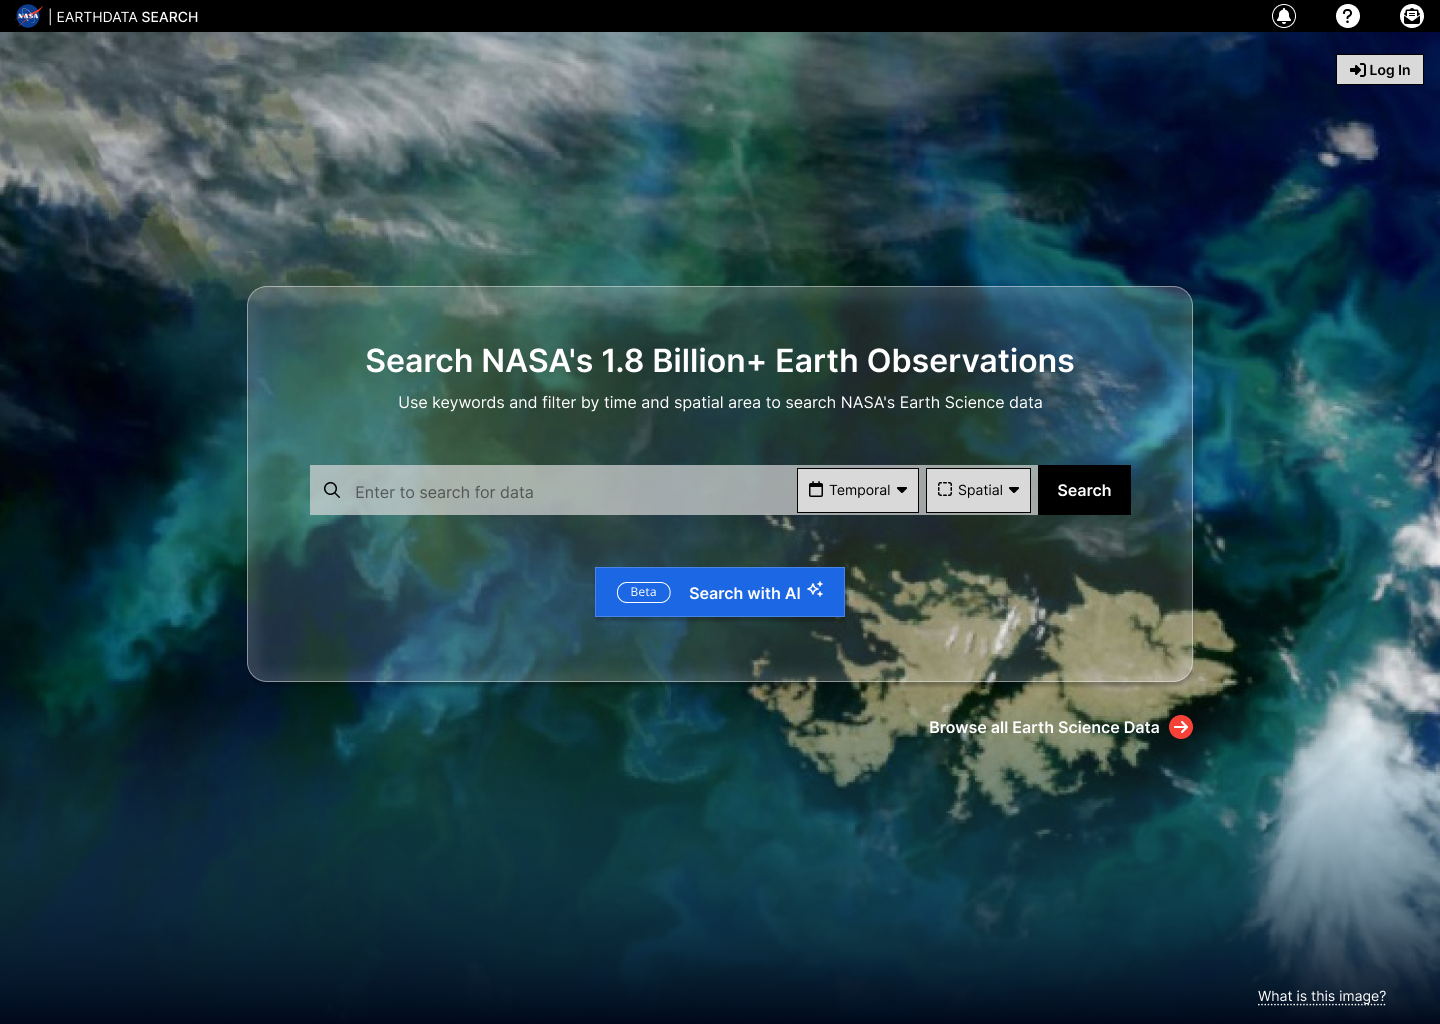
NASA Earthdata Search Landing LLM AI
Results
Reflection
NASA is a globally well-known brand that people come to for reliable science resources. We offer a way to inspire, learn, and share knowledge about our precious home, called Earth.
Our difficult task isn’t whether we have enough data, but how we make it available for anyone to find the right data that they need quickly and with less technical labor. There is more work to be done to understand our users and what experiences we can provide. And we still have some remaining questions to solve:
- Should we offer an all-in-one application with user-based views or a suite of products with smart handoffs?
- How do we migrate users to new tools?
- How do we live up to Open Science and partner with other Earth Science organizations and citizen scientists to build a community?
What we have done so far has helped future-proof our data catalog and its components and has given our users confidence. I hope we will continue to achieve strides in creating experiences that catapult research for generations to come.